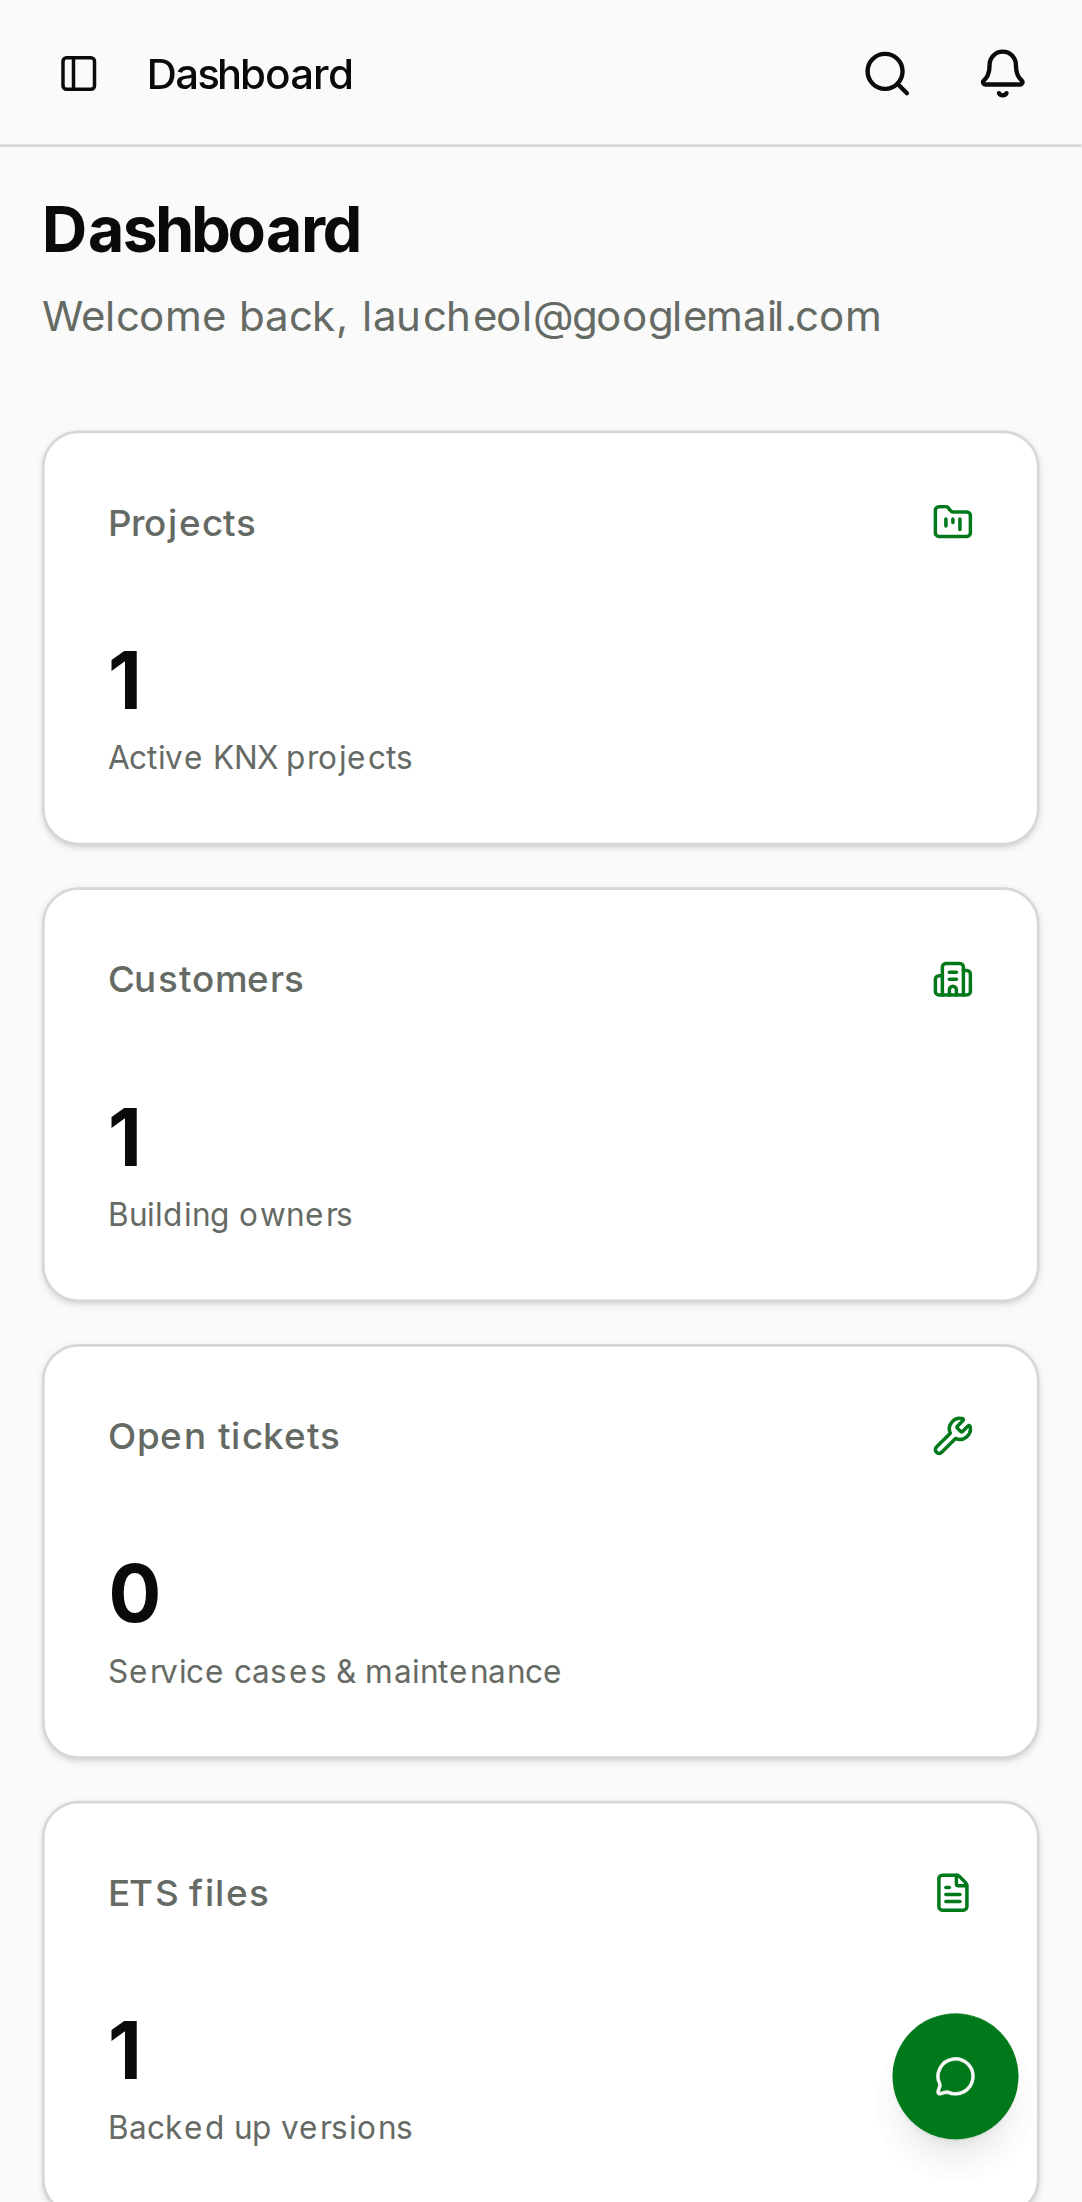
Dashboard
The Dashboard is the first screen you see after signing in. It is a read-only "at-a-glance" view of your organisation — it never lets you mutate anything, so it is safe to leave open on a shared screen.
- Desktop
- Mobile

Layout
- Welcome header — your display name, the current organisation name, and the date the org was created.
- KPI tiles — four tiles summarising your org:
- Total projects
- Total customers
- Team members
- Open service cases
- Recent projects — up to 5 projects sorted by most recent activity. Click a row to open the project detail.
- Recent activity — up to 10 events across the org: project creations, ETS uploads, service-case transitions, team changes. Each item links to the object it references.
What "recent activity" actually tracks
The activity feed reflects rows in the project_activities table
(populated by the backend when projects or their children change)
and audit_logs entries for org-wide events. It is:
- Scoped to the current organisation — switching orgs via the avatar menu refreshes the feed.
- Populated by server-side writes only — client-side navigation is not tracked.
- Retained for the public beta without a retention policy. We will add a retention window before GA.
KPI tile math
| Tile | Source |
|---|---|
| Total projects | projects rows in your org |
| Total customers | customers rows in your org |
| Team members | org_members rows for your org |
| Open service cases | service_cases with status open or in_progress |
All four counts update in near real-time after a mutation (a new project, an accepted invitation, etc.) — if a number looks stale, click the browser refresh button as a first resort.
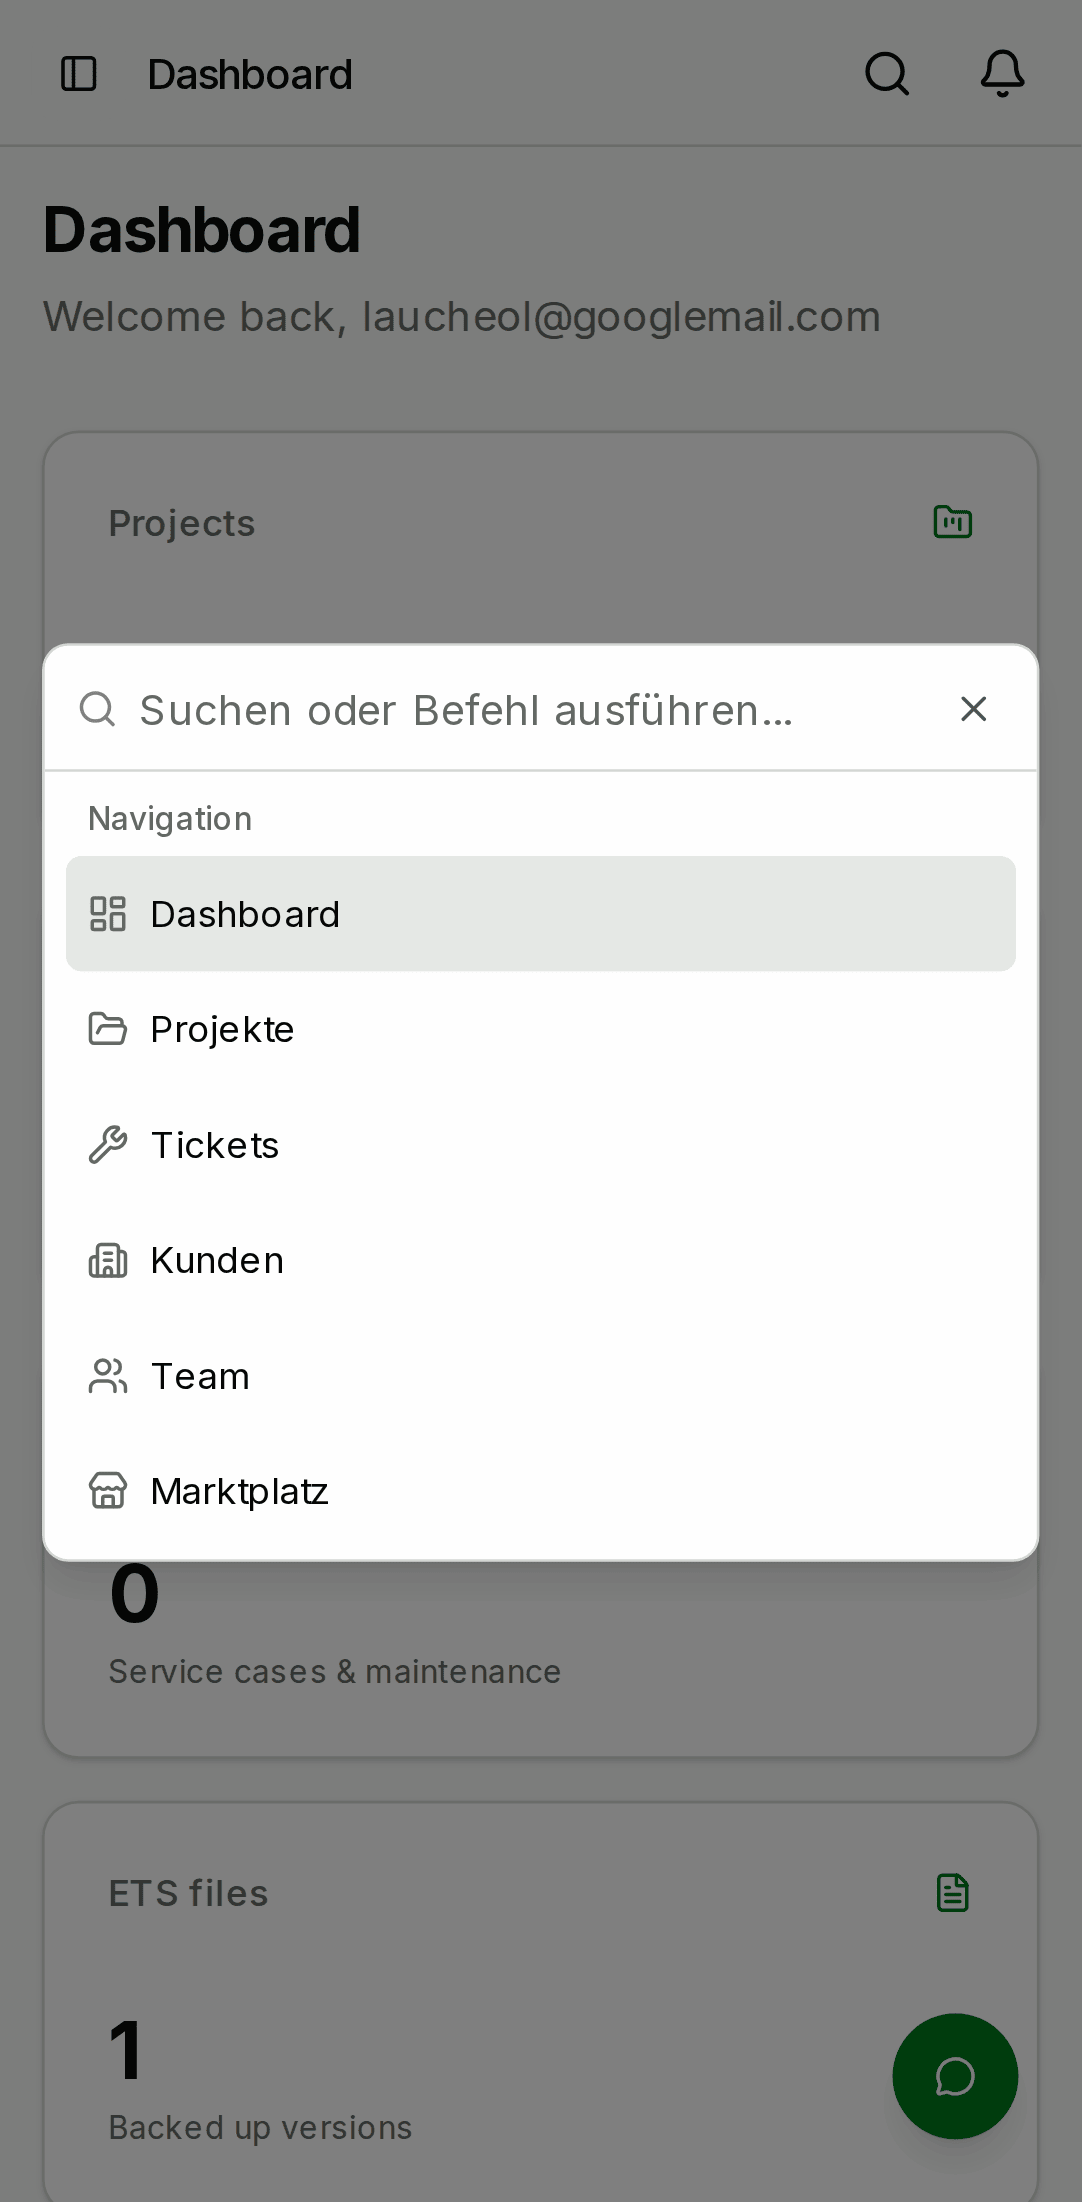
Global search
The sidebar contains a global search input just below the
KNX Clarity logo. It matches against projects, customers, and team
members in your org and navigates to the matched entity on
selection. Use Ctrl+K / ⌘K as a shortcut to focus it from
anywhere inside the dashboard.
- Desktop
- Mobile

Notification bell
The bell icon at the bottom of the sidebar (or in the mobile top
bar) shows unread notifications for your user. Clicking it opens
Notifications. The badge
shows the unread count up to 9; anything above displays as 9+.